Gradient Descent for Beginners
Gradient Descent for Beginners
One thing everybody wants for their machine learning models is to make them learn.
One part of this learning process is Gradient Descent. Gradient Descent is a simple optimization algorithm that helps your model to learn faster.
But how can an optimization function help a model learn?
The idea behind the word “learning” is that with decent training on some data your model learns the underlying patterns in the data. When your model has learnt these patterns very well then it starts making good predictions. Making good predictions mean that your model makes less errors and as a result total error decreases.
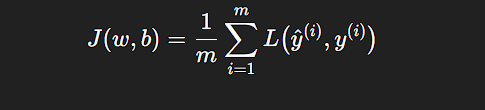
So, we can actually measure how well the model is learning by measuring the overall error in our predictions for some data. We measure this error using cost functions, a cost function basically sums up all the losses on all the examples in the data and averages them out.
Now our goal is to make the model learn, the better the model learns, the lesser our overall error and cost function in turn.
So, now we can re formalize our goal as: Minimizing the cost function.
We minimize this cost function using a simple algorithm called Gradient Descent. This is also called an optimization algorithm because it in some sense optimizing our model to give right predictions. There are a lot of optimization functions other than just gradient descent, like Adam and RMSprop.
Gradient Descent
Cost function function:
Gradient Descent:
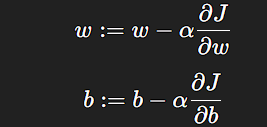
(:=, means “is updated to”)
Gradient Descent just calculates the gradients and makes updates in the parameters (weights and bias) of the model based on the above formula.
The cool thing about the formula above is how it functions when you are at different point on this graph, below.

Our goal is to reach the lowest point in the cost function (J(w,b)). When you are at the far right on this graph this graph of cost function your cost is high, as you can see, so we would like to go to left. When you calculate the slope at this “far right” point you are on then it will obviously come out to be positive.
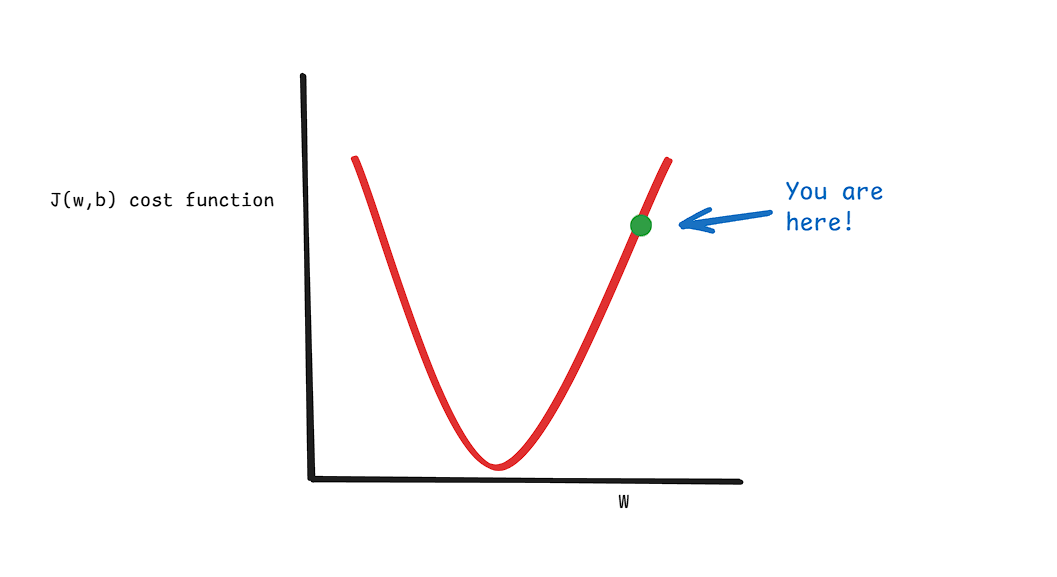
Now according to our formula we go to the opposite of what this slope tells us to do, since the slope is positive here so going right on the cost function would be prepostrous and going to the left will take us to our goal (lowest value of cost function). Using minus sign makes us go to the left or in opposite direction of the slope. You can also see in the formula above that slope is scaled by some constant alpha, this is called learning rate, the bigger it is the bigger steps we will take in a direction opposite to the slope and same is for the opposite.
You can also imagine what would happen if you were at far left point on cost function graph.
When you do this a lot of times (generally number of iteration times) with a decent learning rate (alpha), you are more likely to reach the lowest value of the cost function and as a result the best values for your parameters.
Let’s say you started at far left point then doing the process I mentioned above 10 times you reached the lowest point of the cost function. At this point you when you calculate slope using the above formula it will come out to be 0. So, applying gradient descent at this point won’t take you anywhere, and you also have reached your desired value of cost function and parameters.
In the Higher Dimensions
It’s very easy to imagine how this funtion performs at lower dimensions, but in the higher dimensions it becomes difficult to imagine. But lower dimensions can give us an intuition.
In higher dimensions it has been found to work perfectly well!